
Git Authors Pie Chart is one of the interactive graphs Understand can draw of your code — call trees, dependencies, control flow, and more.
Git Authors Pie Chart
Languages: AnyTargets: Architectures, Files, Project
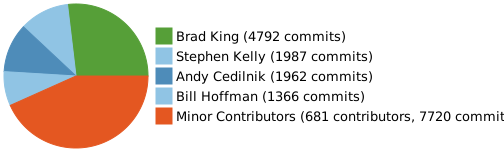
A pie chart of Git authors
Authors can be broken into three categories:
- Owner: the author(s) with the most commits
- Major Contributor: at least 5% of the commits
- Minor Contributor: less than 5% of the commits
Files with strong ownership are preferred, and files with many minor contributors are more bug prone. (Bird, Christian, et al. "Don't touch my code! Examining the effects of ownership on software quality." Proceedings of the 19th ACM SIGSOFT symposium and the 13th European conference on Foundations of software engineering. 2011.)
This pie chart displays the percentage of commits by each author. If there are a lot of authors, all minor contributors are grouped into a single slice. Slices are colored green for owners, blue for major contributors, and orange for minor contributors.
See also the Git Solution, the blog article ↗ describing the Git plugins, the interactive report Git Authors, the architecture Git Owner, and the metrics Major Contributors, Minor Contributors, Ownership and Authors .
This variant is a plugin. It can be enabled/disabled from the Plugin Manager.