Open a graph & choose a variant
Understand can draw the relationships in your analyzed code as an interactive graph — a node-and-edge diagram for things like what a function calls, what a file depends on, how data flows through a variable, or how classes relate. Graphs are available for a single entity, an architecture, or the whole project, and always reflect your most recent analysis. See which graph should I use? to map a question to a specific graph, or the graph catalog for the full list.
Open a graph
- For an entity or architecture: right-click it (in source, the IB, the Architecture Browser, or any list) → Graphical Views, then pick a graph. This works anywhere an entity or architecture appears.
- For the project: Graphs → Project Graphs.
- The toolbar's graph button ( Show Graphic Views Menu) opens Graphical Views for whatever's currently selected.
Other shortcuts on the Graphs menu
The Graphs menu also holds shortcuts unrelated to opening a project graph: an architecture's Dependency Graphs and UML Class Diagram, quick access to Graphical Views for the currently selected entity/architecture, and Load Saved Graph….
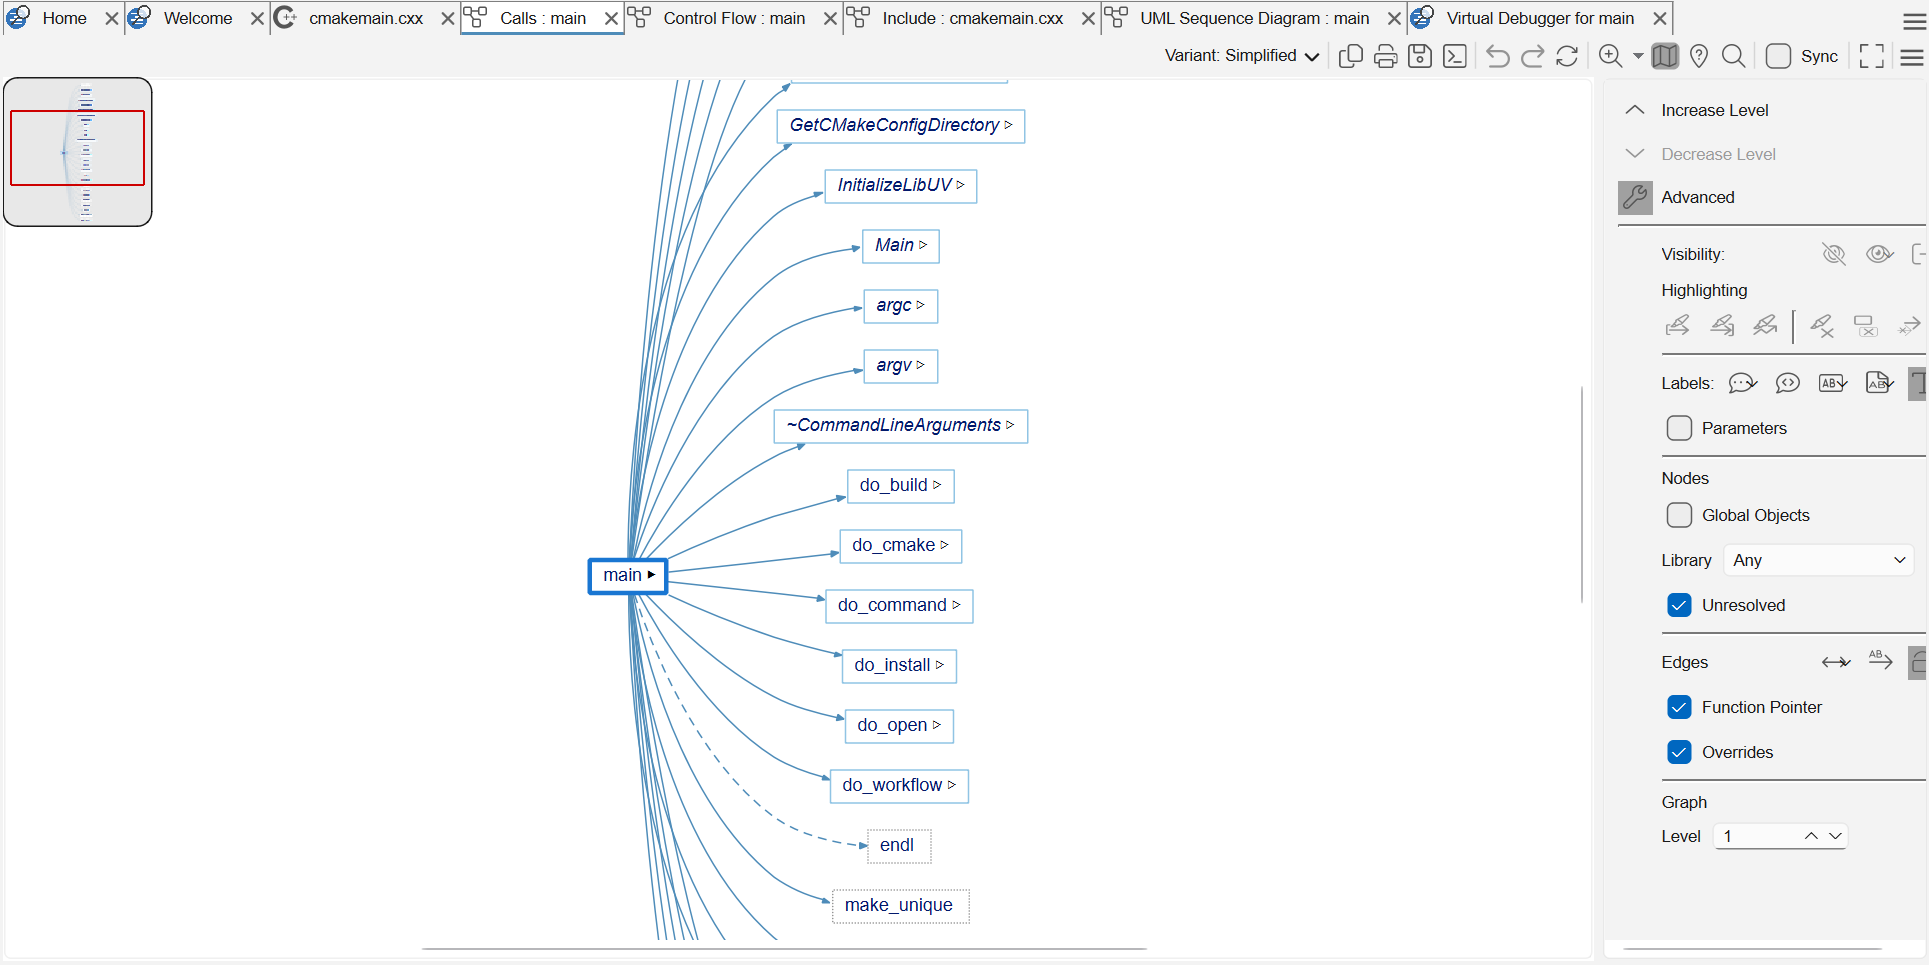
Switch between variants
Related graphs are grouped, so once a graph is open you can switch variants without starting over — pick one from the Variant dropdown in the graph toolbar:
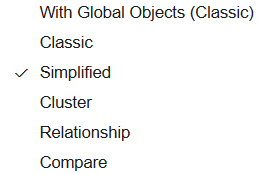
Common variants:
| Variant | What it shows |
|---|---|
| Simplified | A clean, modern view (e.g. a simple call / called-by tree). |
| Classic | The legacy view. |
| Cluster | Groups nodes into collapsible clusters — good for large graphs. |
| Butterfly | Both directions at once (callers and callees, or depends-on and depended-on-by). |
| Internal | Restricts to relationships within the selected scope. |
| Relationship | Prompts you to click a second entity and shows how the two relate. |
| Compare | The cross-version comparison variant. |
| Custom | The default variant name for a plugin graph. |
The variants available depend on the target (entity, architecture, or project) and the graph you chose, and different variants can offer different right-click menu options.
Butterfly: graph or variant?
Butterfly shows both directions around a root, but where it lives depends on the root. For an entity (e.g. a function) it's a graph in its own right — pick it directly under Graphical Views (see the graph catalog). For an architecture it's a variant — of the Dependencies graph and other architecture graphs — which you switch to from the Variant menu.