View & triage violations (Violation Browser)
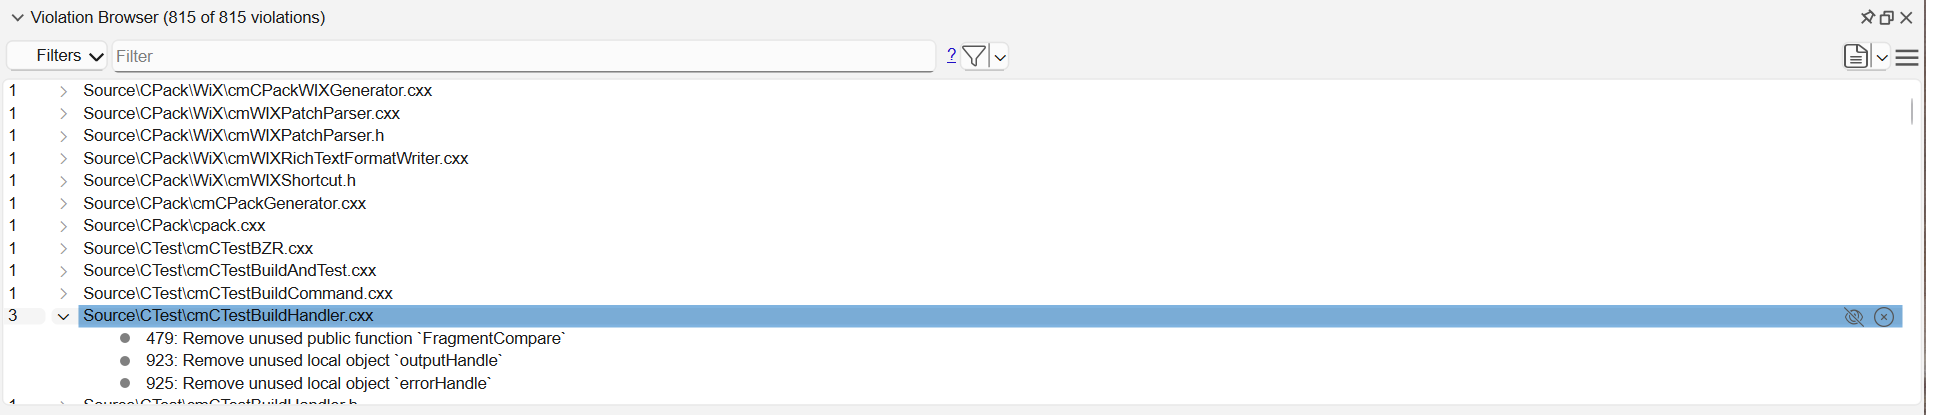
Open the Violation Browser with Checks → Browse Violations (or View → Violation Browser,
Ctrl+Alt+V), or click the warning icon
in the editor toolbar. It lists every violation and analysis
issue in the project, with quick jump-to-source — including results
imported from other tools via SARIF.
Filter to what matters
Use the Filters button for pre-built filters — Analysis Errors, Analysis Warnings, a Severity submenu, and git-based filters (On Uncommitted Lines, In Files Modified Today/This Week). The applied filter is shown in the Filter field, and the syntax is based on GitHub's search syntax — click the ? for the full grammar. If the project is tied to a git repo you can filter by commit hash, branch, or tag.
Right-click a file grouping → Display Files As → Short / Relative / Full Names.
Reading the colored dots
Each row's colored circle tells you what kind of issue it is:
| Color | Meaning |
|---|---|
| dark red | Analysis error (Understand couldn't fully parse — fix these first; they hurt accuracy) |
| gold | Analysis / check warning |
| purple | Path-sensitive check (see Bug Hunter) |
| gray | A regular CodeCheck rule violation |
Act on a violation
Hover a row for quick actions: temporarily remove it, permanently ignore it (see suppress a violation), or apply a Fix-It hint where available. For big result sets, the inspection also offers Treemap and Heatmap views. To track violation counts as a metric over time, see the violation-density metrics (by code lines / by lines).