Explore an unfamiliar codebase (10-minute tour)
Once your project is analyzed, here's the fastest way to get oriented. (Any analyzed project works; the C/C++ examples use the CMake sample.)
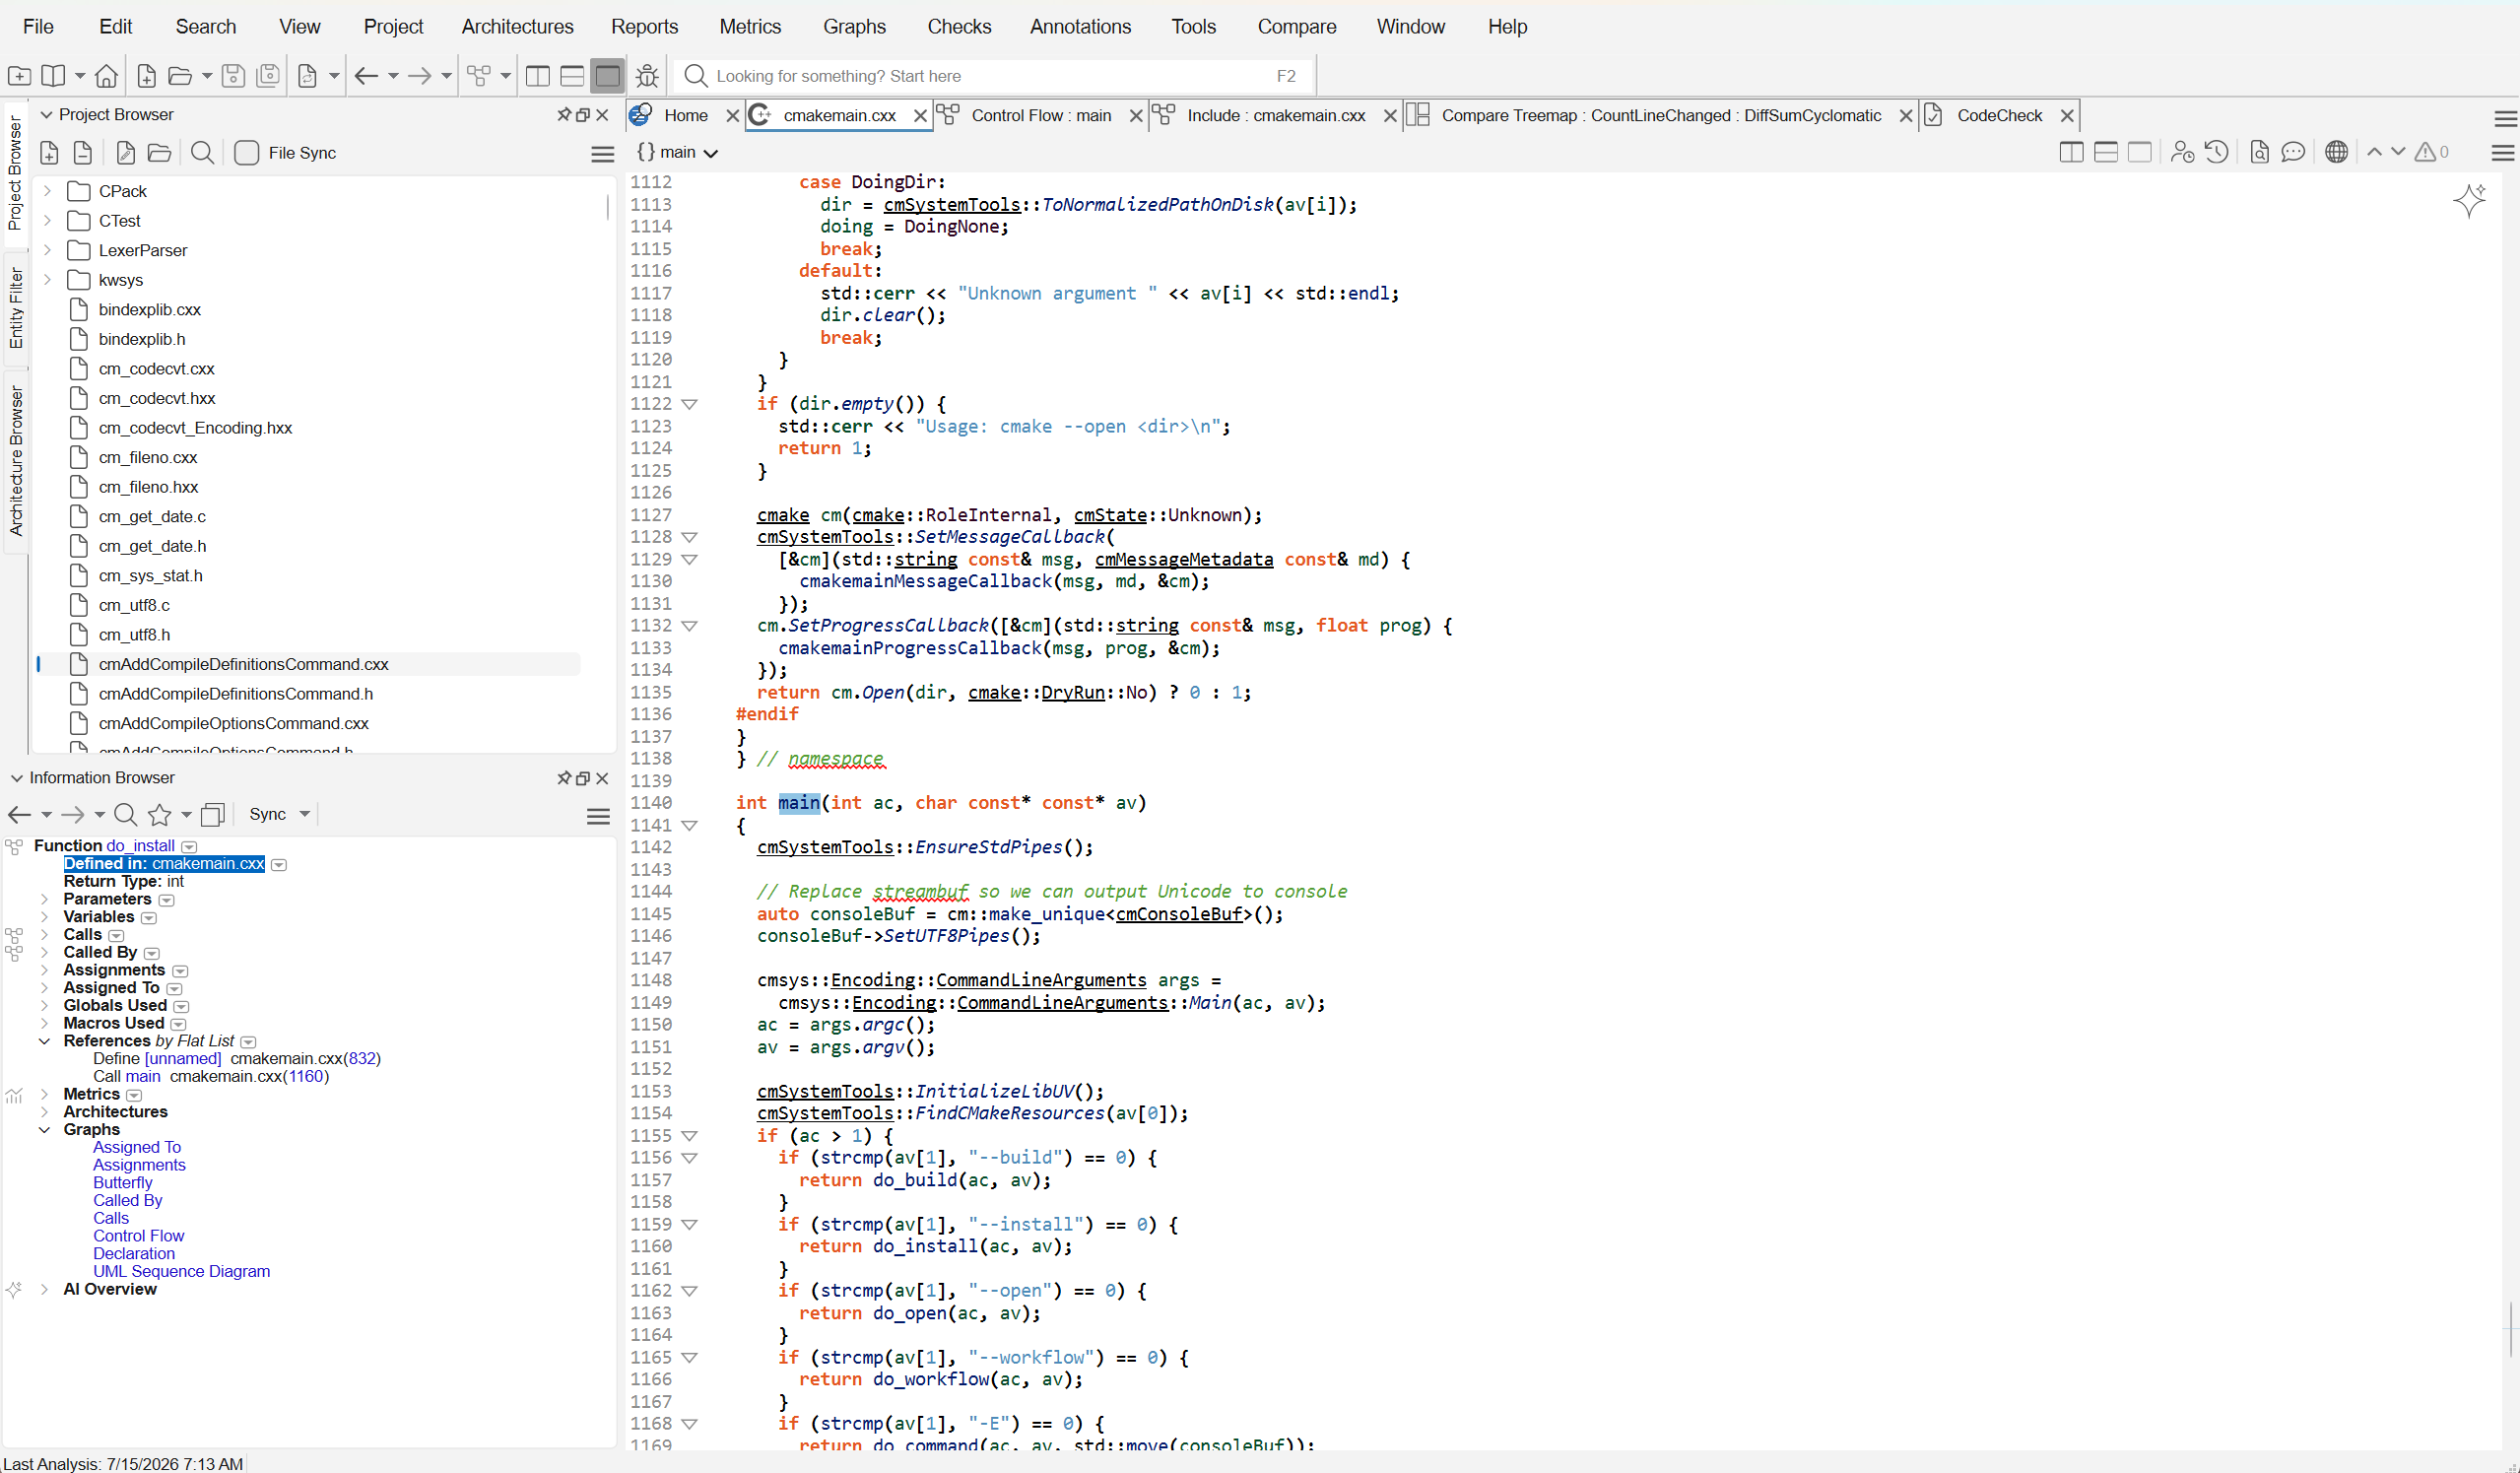
1. Ask "what is this?" — the Information Browser
Right-click any entity — in source, a list, anywhere — and choose View Information (Ctrl+I).
The Information Browser shows what Understand knows about it: what it calls and is called by, its
members, basic metrics, and everywhere it's used. Expand a relationship branch to walk it several
levels deep. See Information Browser.
2. Navigate by clicking — Browse Mode
Turn on Browse Mode (View menu or the editor toolbar) — or just hold Ctrl — and entities in the source become links. Click one to jump to its definition and/or sync the Information Browser; hover for a quick tooltip. See Browse Mode.
As you click around, the Contextual Information window can follow your cursor, showing the current file's structure and the scope you're inside — see Contextual information and scope.
3. See the shape — a graph
Right-click an entity → Graphical Views and open a call tree, control-flow, or dependency graph. Switch variants (Simplified, Cluster, …) to change the view. See open a graph, and Which graph should I use? if you're not sure which to reach for.
4. Find anything fast
- Global search bar (
F2) — type to search entities, file names, file contents, commands, and more from one box. - Entity Locator (View → Entity Locator, or Search → Find Entity) — filter the list of functions/classes/… by name, kind, or metric.
- Find In Files (
F5) — text/regex search across the project.
See find things fast.
5. Reason through logic — the Virtual Debugger
To think through a function's control flow without running it, right-click it →
Start Virtual Debugger (Ctrl+Shift+B). See
Virtual Debugger.