What is the Dependency Matrix? (yes, it's a DSM)
Understand's Dependency Matrix is a classic DSM — a dependency structure matrix (also called a design structure matrix). If you've used a DSM elsewhere, this is the same idea: the parts of your system along both axes of a grid, with each cell counting how much the row depends on the column.
Open one from Project → Dependency Matrix and pick an architecture — its groups become the rows and columns. Any architecture works: directory structure for file-level coupling, or one you've built to reflect your intended design.
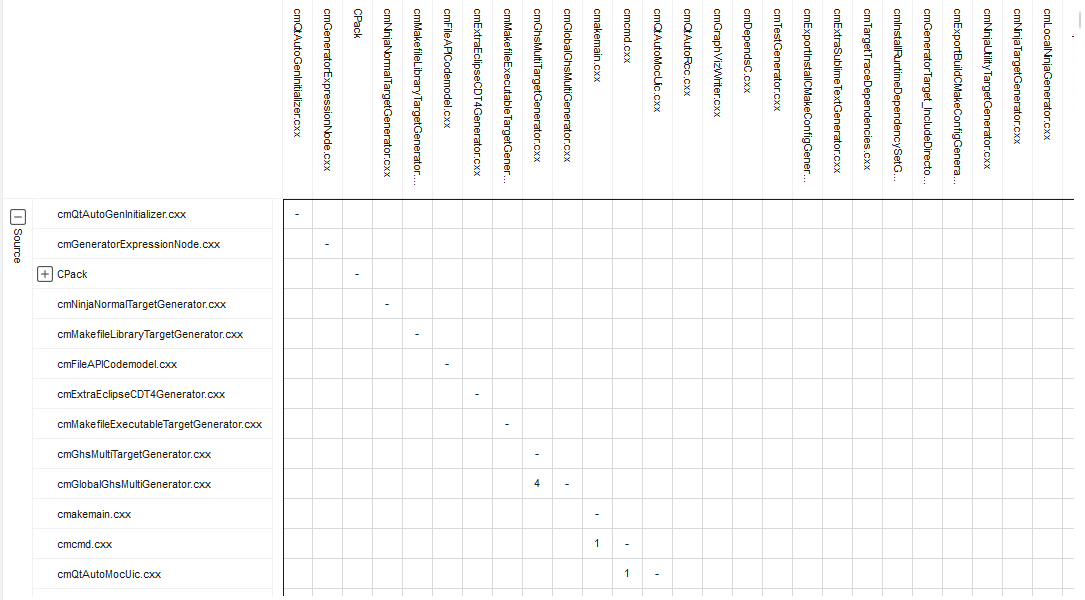
What you're looking at
- Rows depend on columns. The cell where row A meets column B is the number of references from entities in A to entities in B. Hover a cell for the exact reading (A depends on B, n references).
- An empty cell means no dependencies in that direction. The matrix is not symmetric — A → B and B → A are different cells.
- Click a cell to drill in: the references behind that count open in the Dependency Browser, down to the exact lines of code. Click a row or column header to highlight that group's whole row or column.
- Sort (toolbar) orders the groups Alphabetic or By Dependencies; Sync makes the matrix follow the architecture you select elsewhere in Understand. Ctrl+F searches the groups by name.
What to look for
- Cycles. A filled cell and its mirror across the diagonal (A → B and B → A) mean the two modules depend on each other — changes in either can ripple into the other, and they can't be built, tested, or understood in isolation. These mutual pairs are usually the first thing worth designing away.
- Load-bearing modules. A mostly-filled column is a module everything depends on — changes
there are high-risk. Sensible for a core library; a warning sign for something that was supposed
to be a leaf. (The same signal per entity is the fan-in/fan-out and coupling metrics —
CountInput,CountOutput,CountClassCoupled.) - Unstable modules. A mostly-filled row depends on everything else — it's exposed to churn from every module it touches.
- Layering. Sort By Dependencies: in a cleanly layered system the filled cells settle on one side of the diagonal (each layer depends only on the layers below it). Cells on the wrong side are layering violations — candidates for an enforced dependency rule.
To track any of this over time, export the same grid as CSV (Project → Export Dependencies → … → Export Matrix CSV) and diff or chart it between baselines — see Browse & export dependencies, which also covers the same data drawn as dependency graphs.