Where is my risky / complex code?
Understand is deliberately metric-agnostic — it reports the numbers and lets your team decide what "risky" means. This page shows the fastest ways to surface your hotspots — the most complex, largest, and most violation-heavy entities — from a one-glance overview down to a sortable per-entity export.
Pick the tool to match the question
| You want to… | Use |
|---|---|
| A one-screen overview of where risk concentrates | The Home dashboard |
| See big and complex code visually, project-wide | Metrics Treemap |
| Flag entities that cross risk thresholds | Metrics Heatmap |
| Rank every entity by a metric and sort/filter | Export Metrics → CSV |
| Colour a call/dependency graph by complexity | Style a graph |
Start from the Home dashboard
Opening a project's Home page (Project menu → Home, the house icon) gives you ready-made "Most Complex Functions", "Most Complex Classes", "Most Complex Files", and "Largest …" cards, plus a graded Function Complexity summary. It's the quickest way to see whether complexity is a problem and where it clusters. See Reading the Home dashboard for what each card and grade means.
Metrics Treemap — big + complex at a glance
Open Metrics → Metrics Treemap. A treemap draws one box per entity where box size and box colour are each mapped to a metric you choose, so large, hot-coloured boxes are your big, complex units — the hotspots to refactor first.
In the treemap options dialog you control:
- Map metrics for: — the entity kind to show (files, classes, functions).
- Group by: — an architecture to nest the boxes by (e.g. Directory Structure).
- Map Size to: — the metric that drives box area.
- Map Color to: — the metric that drives box colour, with Min Color / Max Color and a Use logarithmic Scale option that pulls extreme outliers into view.
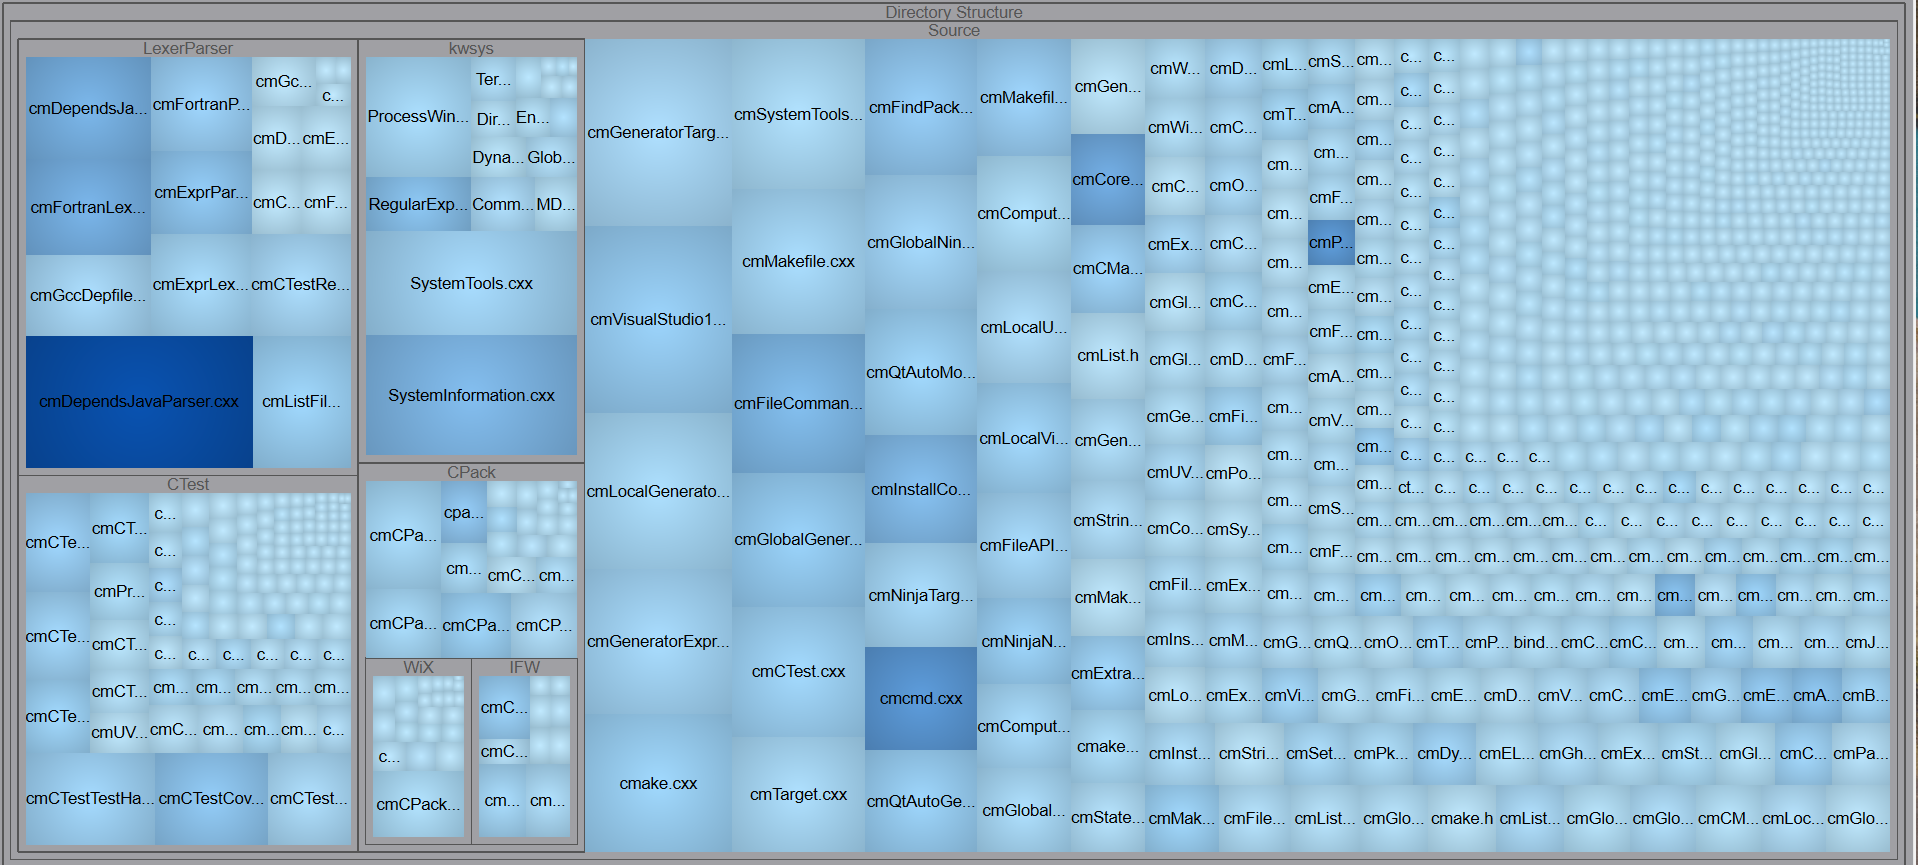
Out of the box the treemap is already tuned for risk: colour defaults to a complexity metric
(MaxCyclomatic for files/classes, Cyclomatic for functions) and size defaults to lines of code
(CountLine). Change either combo to re-map the picture — e.g. colour by CountCCViol to spotlight
violation-heavy files. See what Cyclomatic Complexity means before
you read too much into the colours.
Changes Treemap
The Changes Treemap (on the Compare menu) maps the change in a metric between two versions of your project, so you can see where complexity grew (or shrank) between two points in time.
Metrics Heatmap — threshold-based risk flags
Open Metrics → Metrics Heatmap → By \<architecture> (or right-click an architecture or entity and choose Metrics Heatmap). The heatmap lays out entities against a set of metrics and colours each cell on a pass→fail scale, so entities that cross a risk threshold light up.
The default heatmap flags risk on metrics including MaxCyclomatic (pass 10 / fail 50), MaxNesting
(pass 7 / fail 10), CountCCViol (CodeCheck violations, pass 0 / fail 100), CountAnalysisError, and
comment-to-code ratio. High-complexity, high-violation entities show hot; clean ones stay cool — a
hotspot report for the whole architecture at a glance.
Rank every entity: the Metrics Browser and CSV export
- Metrics → Browse Metrics opens the Metrics Browser — a metric-name → value summary per architecture and per selected entity. It's great for reading aggregates (project totals, per-file averages), but it is not a sortable per-entity ranking.
- To rank every entity by any metric, export and sort externally. From the Metrics Browser toolbar
use Export to CSV / Export to HTML (or Metrics → Export Metrics). Then sort the CSV by,
say,
Cyclomaticdescending to get your worst offenders first. - Headless,
und metrics myProject.undwrites the project's configured metrics, one row per entity, to CSV. Choose the columns with the metric settings — see Export & track metrics and Run Understand from the command line.
For other ways to rank entities by a metric — an in-GUI sortable column, or a per-kind chart/histogram graph — see Rank & compare entities by a metric.
Enforce a complexity limit
Once you know where the complexity is, you can make crossing a threshold fail a check rather than relying on eyeballs: CodeCheck ships with complexity-based and structure-based rules you can turn on and run in CI. See What is CodeCheck? and View & triage violations.