Where did the churn happen? the Changes Treemap
Once you've set a comparison database, the Changes Treemap shows where the change concentrated. It draws one box per changed entity, with box size and box colour each mapped to a change metric — so the big, hot boxes are the entities that moved the most.
Two treemaps, two questions
Understand has two treemaps. The Metrics Treemap (Metrics menu) shows your whole codebase sized/coloured by absolute metrics — see Where is my risky / complex code?. The Changes Treemap (Compare menu) shows only what changed between two versions, sized/coloured by change metrics. Reach for the Changes Treemap to answer "what did this release touch?"; the Metrics Treemap to answer "where is my risk right now?".
Open it
Set a comparison database first (Compare → Comparison Projects), then choose Compare → Changes Treemap. The menu item is disabled until a comparison database is set.
Only entities that differ between the two versions become boxes — added, removed, and changed entities. Everything unchanged is omitted, so the picture is pure signal about the delta.
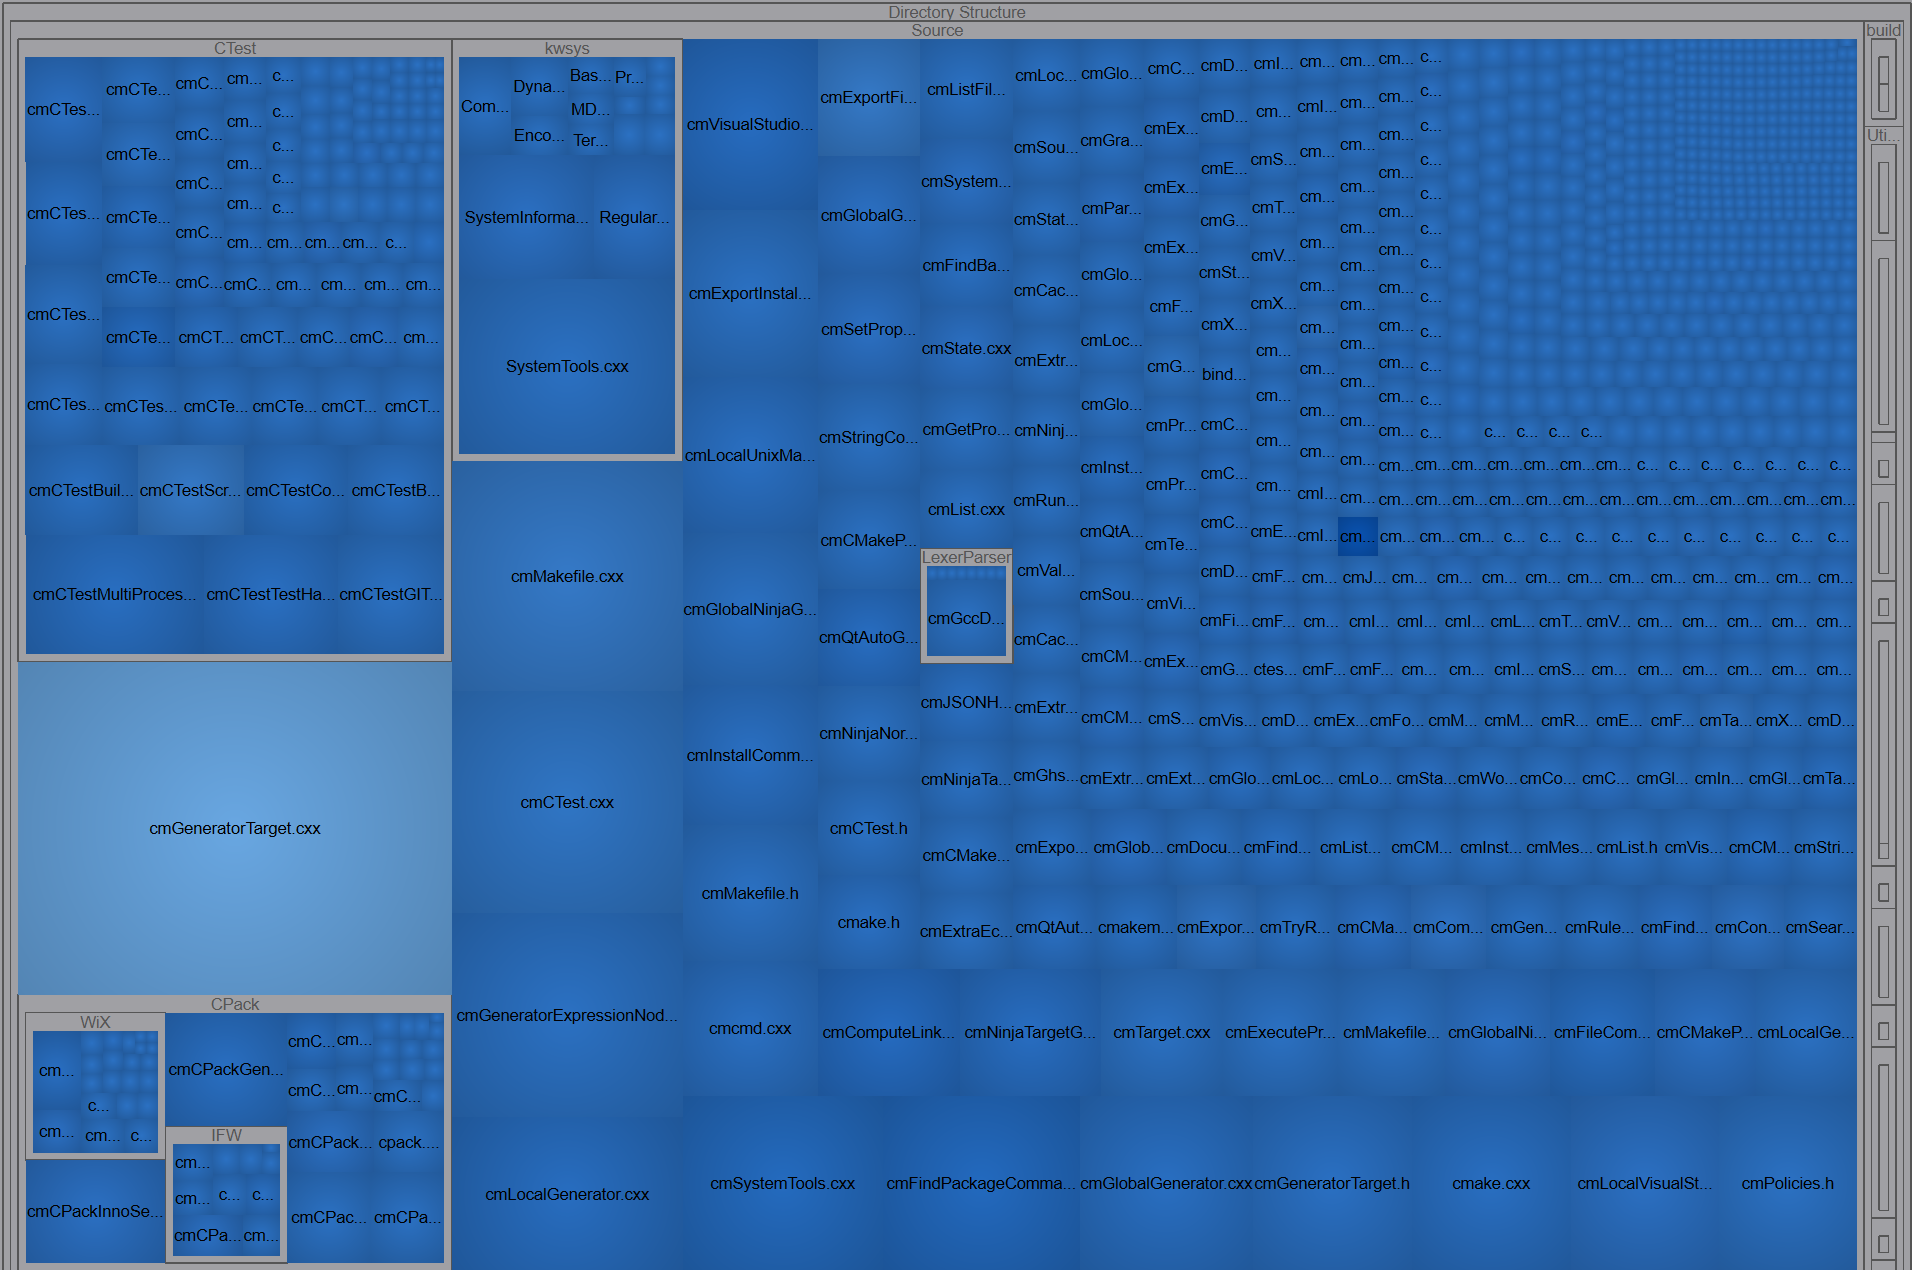
cmGeneratorTarget.cxx) carried a huge share of this release's churn.Read it
Both size and colour are driven by change metrics you pick in the options dialog. The defaults:
| Entity kind | Box size | Box colour |
|---|---|---|
| Files, Classes | Percent Changed (PercentChanged) |
Change in Sum Cyclomatic (DiffSumCyclomatic) |
| Functions | Percent Changed (PercentChanged) |
Change in Cyclomatic (DiffCyclomatic) |
So by default a large box means a high proportion of the entity's lines changed, and a hot
colour means its complexity moved a lot. The available metrics to map are the change metrics:
New Lines (CountLineNew), Removed Lines (CountLineRemoved), Changed Lines
(CountLineChanged), Percent Changed (PercentChanged), and the signed deltas DiffCountLine,
DiffCountLineCode, DiffCountPath, and the cyclomatic diff.
It's a gradient, not a category
Colour is a continuous two-colour scale over the chosen metric — it is not a red/green
add-vs-remove key. Added-vs-removed direction shows up in the signed delta metrics (a negative
DiffCountLine means the entity shrank). Use the Changed Entities Locator or the
diff when you need the discrete Added/Changed/Removed status.
Change what it maps
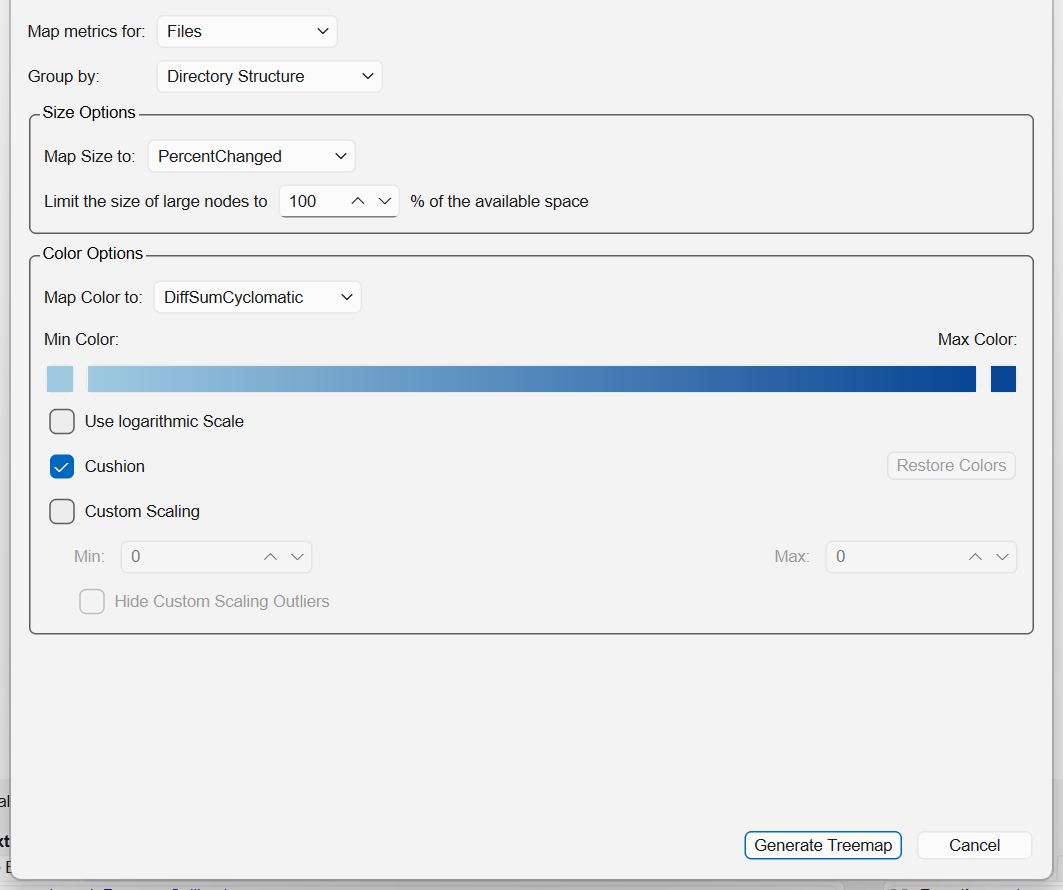
The Changes Treemap uses the same options dialog as the Metrics Treemap, so the controls are familiar:
- Map metrics for: — the entity kind to show (files, classes, functions).
- Map Size to: / Map Color to: — the change metrics driving box area and colour.
- Group by: — nest boxes by an architecture.
- Min Color / Max Color and Use logarithmic Scale — tune the colour scale (log scale pulls extreme outliers into view).
Press Generate Treemap to apply. Click a box to open the side-by-side comparison of that entity's old and new source.