Style a graph — color nodes by a metric
Styling turns a graph into a quick visual signal — e.g. shade a call tree by complexity so risky functions pop.
Start with the legend
Styling is done from the graph's legend, so turn it on first: the Legend action on the graph toolbar opens a floating legend that lists the graph's node and edge styles.
Only graphs with an editable legend can be restyled — those show a hamburger ( ) menu on the legend. That menu is where you add styles, add a metric color scale, and manage themes; the exact commands depend on the graph (for example, control-flow graphs have no node/edge styles, and graphs whose edges aren't references — like architecture graphs — have no Add Edge Style). To tweak an existing style, right-click its entry in the legend.
Color by a metric
From the legend's hamburger menu choose Add Metric Color Scale (offered when the graph has metric
data). Pick a Metric (e.g. Cyclomatic, CountLineCode — the
metrics catalog lists them all) and either leave Automatic Range on
or set a fixed min/max. The scale is added to the legend; apply it by choosing it as a node style's
fill color (right-click a node style → fill). A node with no value for that metric falls back to
its style's plain default color rather than the gradient. The Default style itself can't be set to
a metric color scale — it's the fallback for nodes that match no other style, so it has nothing to fall
back to if it were metric-driven.
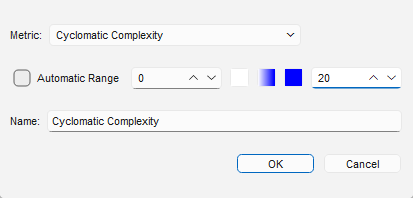
Cyclomatic Complexity mapped to a white-to-blue gradient over
0–20.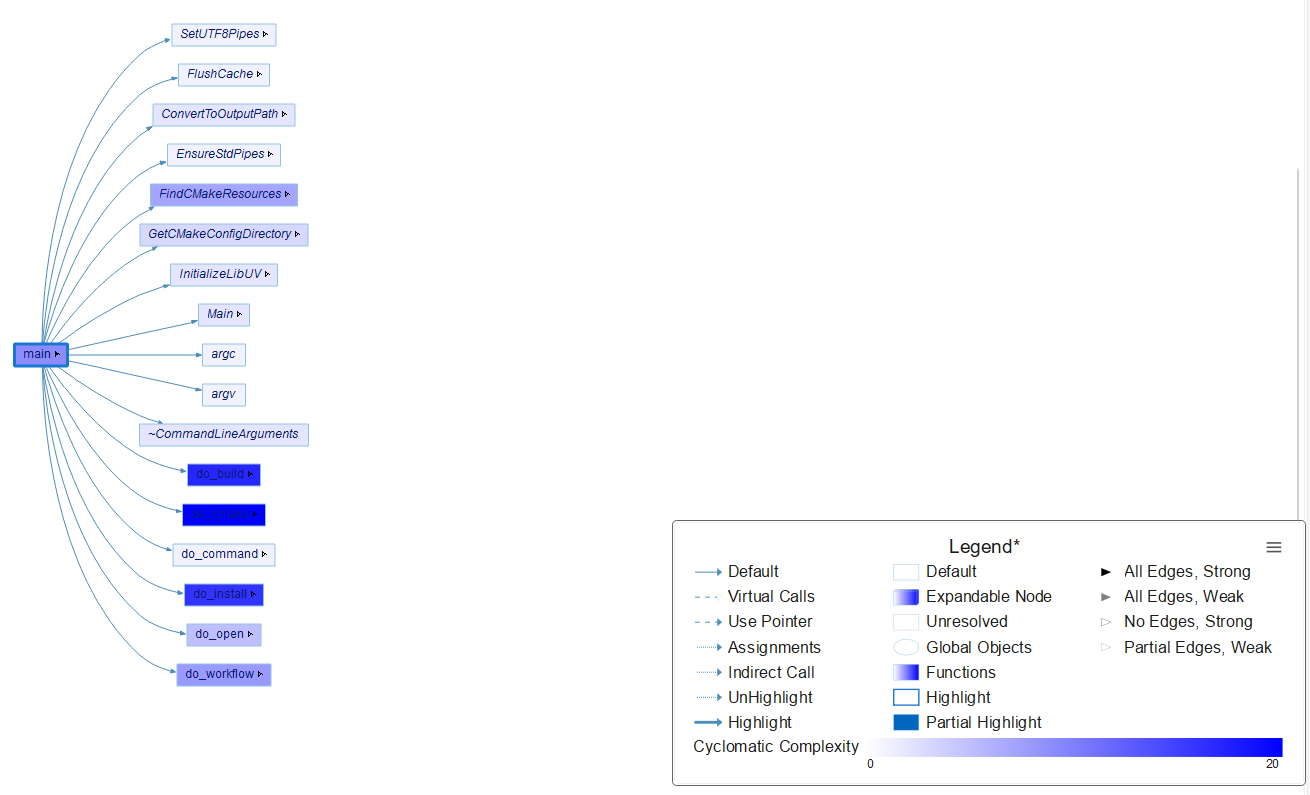
Cyclomatic Complexity, where the riskiest function (do_cmake) pops
immediately. The Legend shows the scale and every style in play.The same color scale can be applied to edges too, using a line metric (a metric with a value per source line, like coverage hits) — assign it to an edge style's color the same way. This is how you get a graph that, say, shades Use/Set edges by test-coverage hits; see Showing Line Coverage for a worked example. Line metrics are otherwise invisible — not in the Metrics Browser, Entity Locator, or exports — this is the only place they surface. See Write a metric plugin for how a plugin defines one.
Add & edit node and edge styles
- Add Node Style opens a style dialog with a rule — an entity-kind filter (type one, or pick from the filter dropdown) — so the style applies to matching nodes. When several styles match, the last one listed wins.
- Add Edge Style does the same for edges, matched by reference kind (e.g. Call, Include, Use). It's offered only for graphs whose edges are references — not control-flow or architecture graphs. Unlike node styles, edge colors stack: if more than one style matches an edge, their colors combine instead of the last one winning.
- Right-click a legend entry to change its appearance — for nodes: color, shape, and icon; for edges: color, line style, and arrow head/tail.
- Built-in styles can be disabled and re-enabled (the Global Node/Edge Styles submenus) but not deleted.
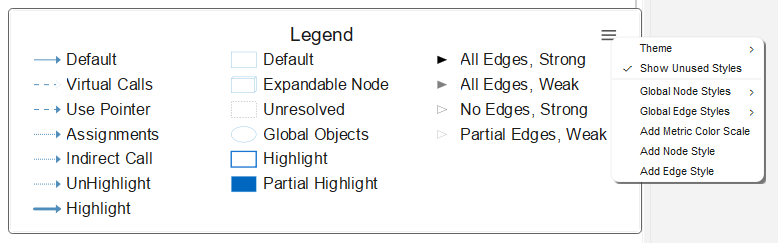
Save & share styles as themes
Capture your styling as a reusable theme from the legend's Theme commands: save a New
Theme (a display name plus an import ID) or update an existing one, and Export / Import
themes as JSON so a team can share a consistent look. Themes are specific to a graph type — a
dependency-graph theme is separate from a control-flow theme. An asterisk (*) in the legend's title
marks unsaved changes.