Browse & export dependencies
Understand derives the dependencies between files, classes, and architectures from the references in your analyzed code — What are dependencies & how are they determined? covers what counts as a dependency and where each one comes from. This page is about putting them to work: browsing them interactively, viewing them as graphs and matrices, and exporting them from the GUI or the command line.
Open the Dependency Browser
Right-click any file, directory, or architecture → View Dependencies (also on the View → Dependency Browser menu). The Dependency Browser opens, docked at the bottom by default. Hold Shift while opening to force a new window.
It's a two-pane tree. Switch the relationship with the direction control:
| Mode | Shows |
|---|---|
| Depends On | What the selected entity depends on. |
| Depended On By | What depends on the selected entity. |
| References From / References To | The individual references behind those dependencies. |
The options (dimple) menu adds Group By, Nested Groups (Off / All / If > N References), Architecture Tree, and References Sorted By controls so you can shape the view. Every edge keeps the references that caused it, so you can expand down to the exact lines of code.

See it as a graph
The browser's graph button opens the dependency graph for the current selection. You can also open these directly:
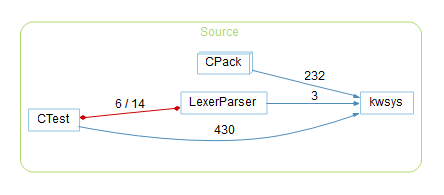
- Graphs → Dependency Graphs → pick an architecture, or right-click an architecture → Graphical Views → Dependencies — the internal dependencies of that architecture: each node is one of its groups, and each line means dependencies exist between the two groups it connects. Blue lines are one-way, red lines are mutual; the number on a line is the dependency count (right-click a number to list them). This is the Internal variant — the default for a root architecture, which has no sibling architectures to depend on or be depended on by, so the Butterfly, Depends On, and Depended On By variants don't apply; a non-root architecture opens to Butterfly by default instead, showing both directions to its sibling architectures. File Dependencies shows the same architecture broken down to individual files instead of groups.
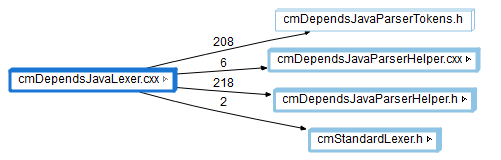
- Right-click a file or class → Graphical Views → Depends On or Depended On By to follow just one direction, or → Butterfly for its Dependencies variant to see both at once — the entity centered, dependents fanning out on one side and dependencies on the other, with a separate depth control for each wing.
That comparison coloring comes from having a second project version open — see comparing two versions of a project.
Read a dependency matrix
Project → Dependency Matrix shows the same data as a DSM grid — source rows against destination columns, a count in each cell, one click from the references behind it. See What is the Dependency Matrix? for how to read one and what to look for.
Export dependencies
Project → Export Dependencies has three submenus — Architecture Dependencies, File Dependencies, and Class Dependencies — each offering:
| Format | Extension | Notes |
|---|---|---|
| Export CSV | .csv |
Flat list of from → to dependencies. |
| Export Matrix CSV | .csv |
Counts as a source × destination grid. |
| Export Cytoscape XML | .xml |
Cytoscape XGMML graph, ready to open in Cytoscape. |
| Export Dot | .dot |
Graphviz Dot (Architecture Dependencies only). |
Choosing a format opens the … Dependencies Export Options dialog: pick the From/To columns, Relative vs Long names, sort column, and totals. The Dependency Browser toolbar also has a quick Export CSV for the current view.
Automate it with the CLI
Export the same data headlessly with und:
und export -dependencies file csv output.csv myProject.und
und export -dependencies arch "My Architecture" csv output.csv myProject.und
und export-dependencies takes a kind (file, class, or
arch), an output format, and the output file; the arch kind takes the architecture name as
an extra argument.