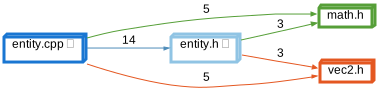
Depends On is one of the interactive graphs Understand can draw of your code — call trees, dependencies, control flow, and more.
Depends On
Languages: AnyTargets: Classes, Files
Variants: Classic, Cluster, Compare
Show the files or classes the selected file or class depends on.
Dependencies map references to their owning file, class, or architecture. So a file's dependencies are the other files that own entities it references. For example, if a function defined in fileA calls a function defined in fileB, then fileA depends on fileB. References that contribute to dependencies vary by language, but generally include call, set, use, modify, and type references.
Dependencies always stay at the same grouping: file will only depend on other files, classes on other classes, and architectures on other architectures within the same root architecture.
Depends On - Classic
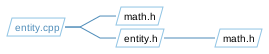
Rooted at entity.cpp in the sample project, the graph shows a direct dependency on entity.h (its own header) through 7 references and on math.h through 5 references. Plus, one step further, entity.h depends on math.h through 3 references. See Depended On By for the reverse direction.
The Classic variant shows the relationship as a simple tree (no clusters) using a custom layout algorithm instead of Graphviz.
Depends On - Cluster
Rooted at entity.cpp in the sample project, the graph shows a direct dependency on entity.h (its own header) through 7 references and on math.h through 5 references. Plus, one step further, entity.h depends on math.h through 3 references. See Depended On By for the reverse direction.
The Cluster variant shows each file/class once. In the GUI, the files/classes can be expanded to show the entities for each reference.

Depends On - Compare
Rooted at entity.cpp in the sample project, the graph shows a direct dependency on entity.h (its own header) through 7 references and on math.h through 5 references. Plus, one step further, entity.h depends on math.h through 3 references. See Depended On By for the reverse direction.
The Compare variant shows how the graph has changed relative to the project's comparison database.