Reading the Home dashboard — grades & technical debt
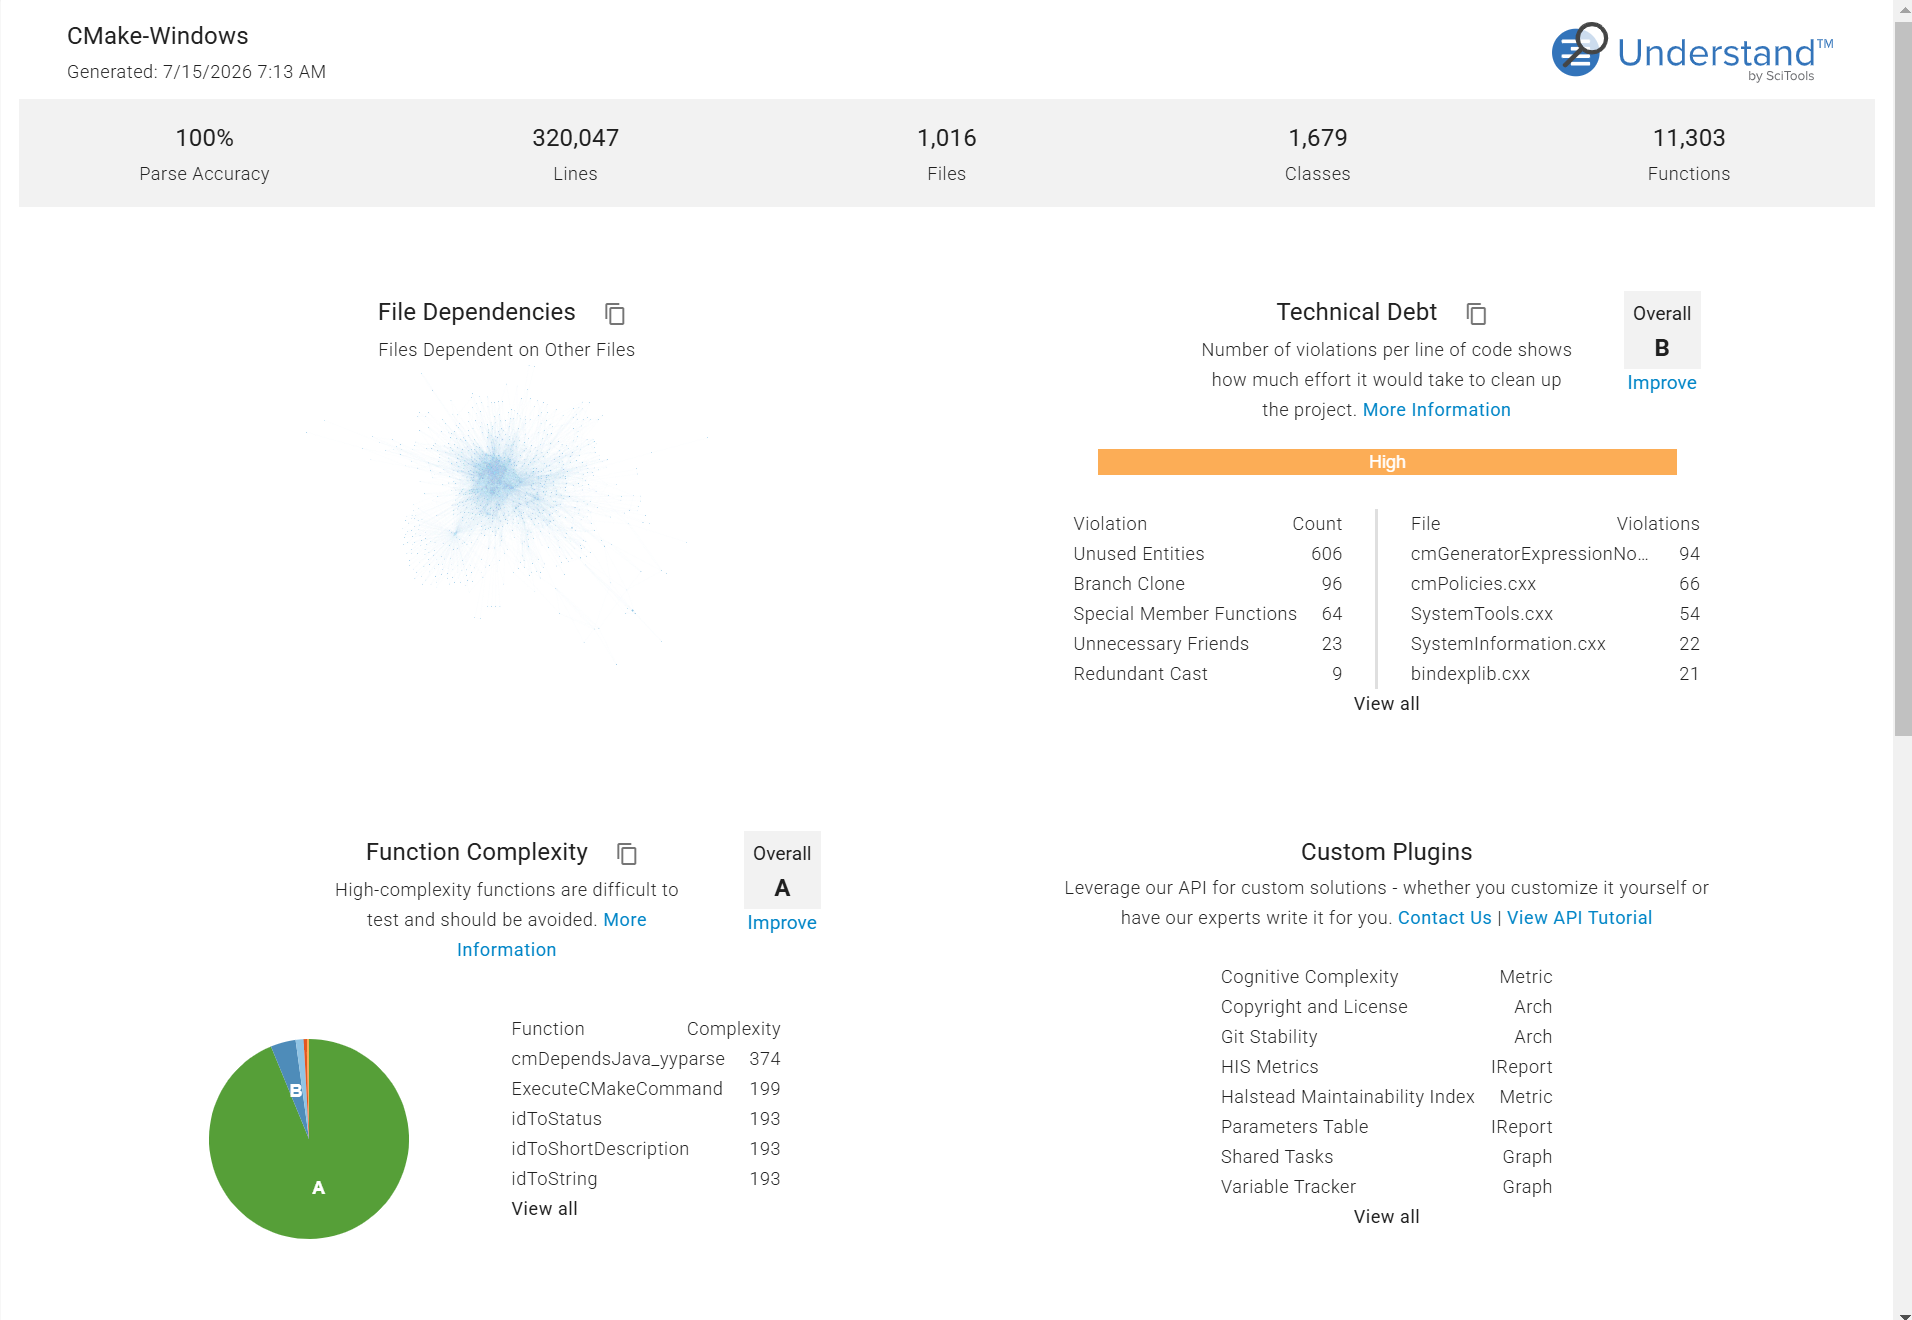
Every project has a Home page (internally, the Project Overview) — a dashboard of summary charts that answers "how big is this project, where's the complexity, and how much debt am I carrying?" in one screen. Open it from the Project menu → Home (the house icon on the project toolbar).
Home vs. Welcome
The Home dashboard is the per-project overview described here. It's a different screen from the Welcome page — the start screen that lists and pins your recent projects when no project is open.
The summary strip
Across the top, the dashboard shows project totals — Lines, Files, Classes, and Functions — alongside analysis health fields:
| Field | When it appears |
|---|---|
| Parse Accuracy — percentage of files that parsed with no errors or warnings | Whenever the project has been analyzed |
| Errors from the last analysis | Only if there is at least one |
| Warnings from the last analysis | Only if there is at least one |
| Missing Includes | Only if there is at least one |
The last three are reported only when the count is non-zero, so a strip showing just the totals and Parse Accuracy means the analysis found nothing to flag. Don't read a missing field as a missing feature.
Parse Accuracy is the number to watch first: low accuracy means the analysis below it is incomplete. See Make analysis accurate if it's low.
The chart cards
Below the strip is a grid of cards. The risk-oriented ones are:
- Function Complexity — distribution of functions by complexity, with an A–F grade (see below).
- Technical Debt — a violation-density grade (see below, including when this card appears).
- Most Complex Functions / Classes / Files and Largest … — ranked lists that jump you straight to the worst offenders. These are the dashboard shortcut to finding risky code. Ada projects also get Most Complex Packages and Largest Packages; cards with no data for your languages aren't shown. For the same ranking against any metric, entity kind, and count instead of the fixed ones here, see Rank & compare entities by a metric.
- File Dependencies, Directory Structure, Line Breakdown, and any Custom Plugins charts.
How the grades work
Several cards show a single A / B / C / D / F letter in a score box; hover it for the underlying value and unit. Grades are computed per card — there is no single overall project grade — by bucketing a value against fixed thresholds.
SciTools doesn't grade your code good or bad
Understand is metric-agnostic. These letter grades are a convenience mapping of well-known industry thresholds onto a value; treat them as a conversation starter, not a verdict.
Function Complexity grade
Based on the average Cyclomatic Complexity across all functions and methods, mapped as:
| Avg. Cyclomatic | Grade | Reading |
|---|---|---|
| 1–10 | A | Simple, little risk |
| 11–20 | B | More complex |
| 21–35 | C | Complex |
| 36–50 | D | High risk |
| > 50 | F | Untestable, very high risk |
For what the number actually measures, see What does Cyclomatic Complexity mean?.
Technical Debt grade
Technical Debt here is a violation density, not a time or money estimate
Understand computes the Technical Debt score as CodeCheck violations ÷ lines of code
(the CCViolDensityCode metric) — a ratio, not an hours- or dollars-to-fix figure. Compilation
errors and warnings are excluded from the count.
The density is graded:
| Violation density | Grade |
|---|---|
| < 1 per 1,000 LOC | A |
| > 1 per 1,000 LOC | B |
| > 1 per 100 LOC | C |
| > 1 per 10 LOC | D |
| > 1 per line | F |
The Technical Debt card only appears when the project is licensed for CodeCheck (or BugHunter). It also breaks the violations down by severity (Urgent / High / Medium / Low / Informational), lists the most frequent violations, and shows the files carrying the most. Because the score is driven entirely by CodeCheck, the way to move the grade is to fix or triage violations — enable a shared configuration of checks and work the Violation Browser. A large chunk of many projects' debt is dead code.