Trace logic with the Virtual Debugger
The Virtual Debugger lets you step through a function's logic by hand, without running the code — ideal when you can't run it, can't reproduce a bug in a live debugger, or just want to reason methodically about the control flow. You make the branch decisions; it records the path. (For the whole function's branch structure at a glance, open its control-flow graph instead — the Virtual Debugger is for walking one path at a time.)
Start it
With a function selected (find one fast), right-click →
Start Virtual Debugger
(Ctrl+Shift+B), or use the
debug toolbar. (It's offered only for debuggable functions; if none is selected you'll be prompted to
pick one.) The window opens as Virtual Debugger for
Step through
Drive it with the toolbar buttons or keyboard:
| Action | Key |
|---|---|
| Previous statement | Up |
| Next statement | Down |
| Enter block | Right |
| Enter function | Enter |
| Exit function | Esc |
At decision points you choose the branch; the debugger tracks the Path you took. Use Copy to Clipboard to hand that path to whoever's fixing the bug.
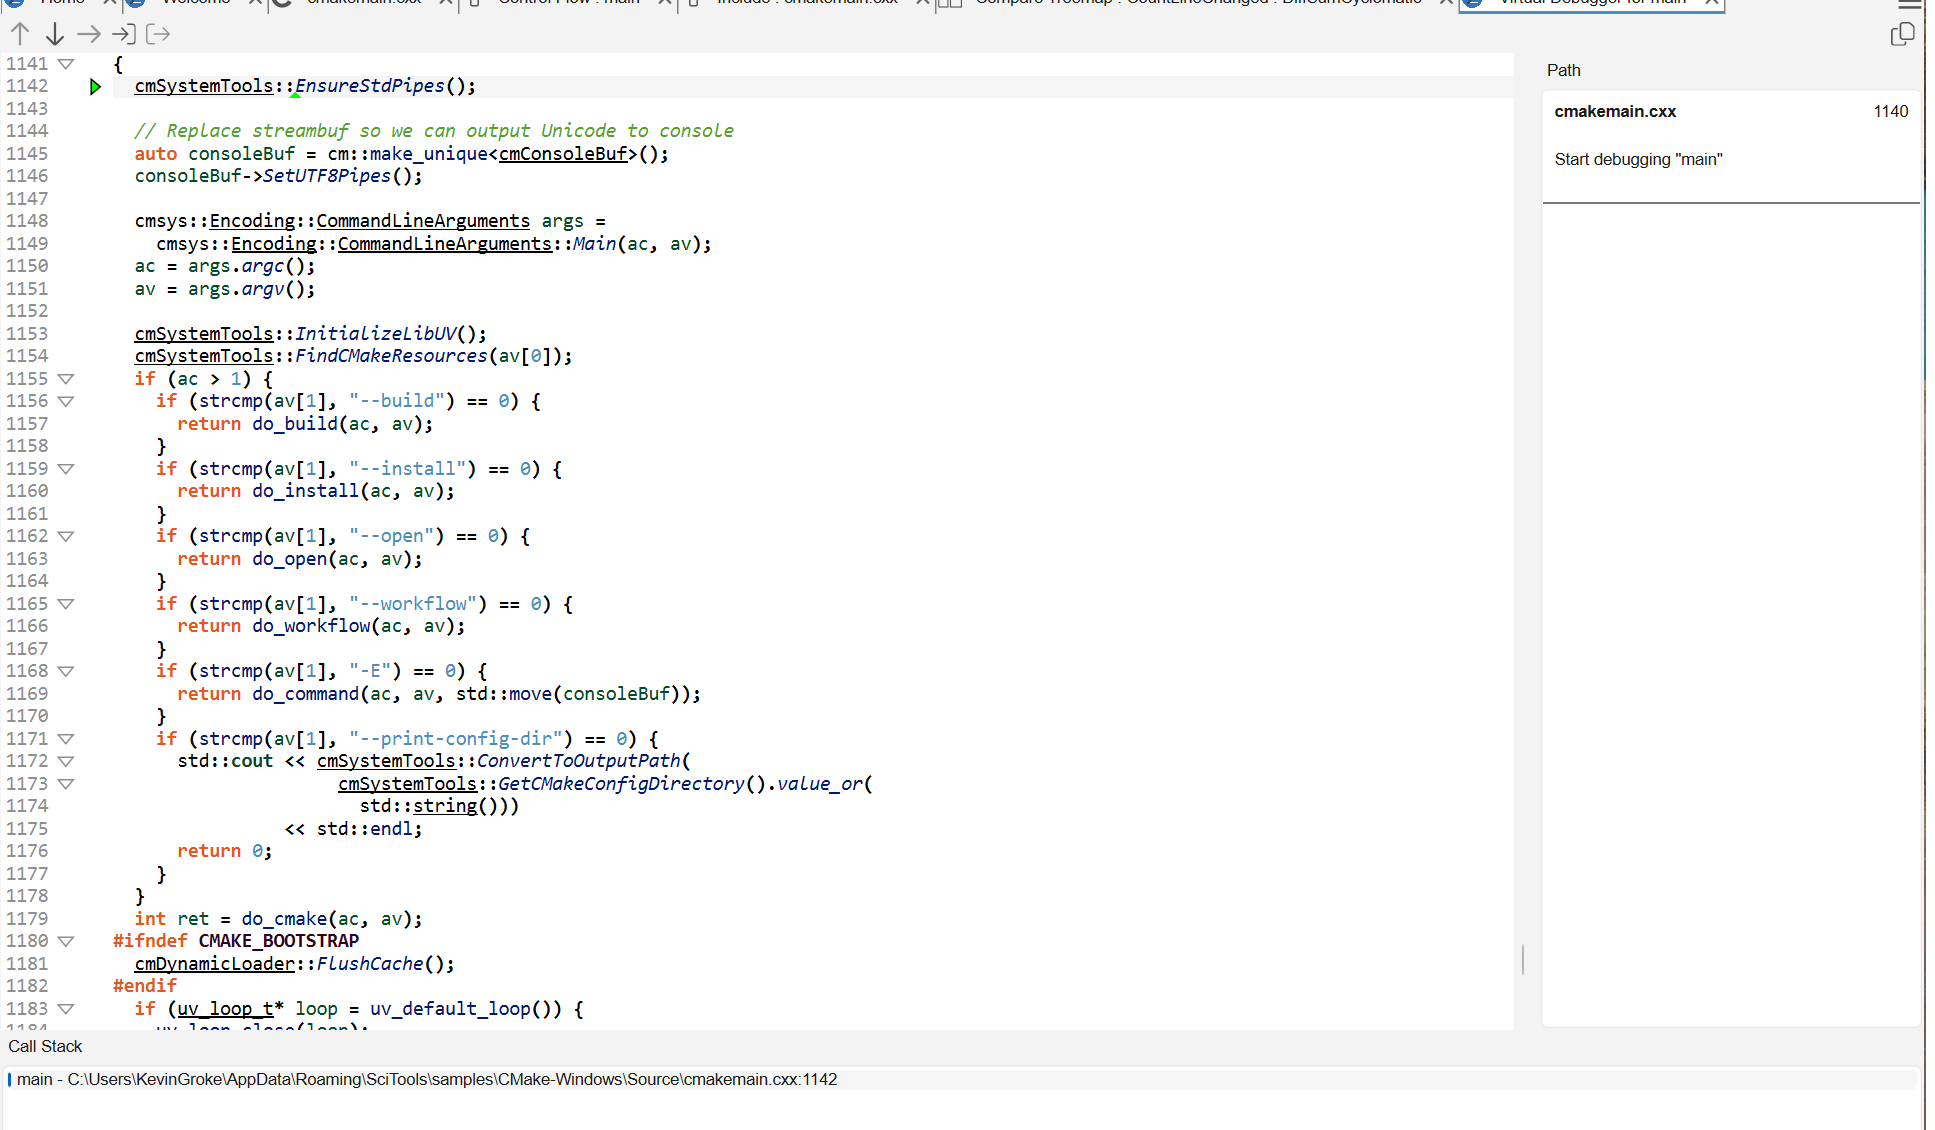
main — the arrow marks the current statement,
the Path panel (right) records every step you take, and the
Call Stack (bottom) tracks where you are.To keep a function's structure and enclosing scope in view while you read rather than step, use Contextual information and scope.
Track what you've checked with the List Browser
The Virtual Debugger walks one path; the List Browser keeps score across a whole investigation. It holds references you've collected, each with three flags you can toggle — so on a call tree spanning dozens of functions you can see at a glance what you've already looked at and what you haven't. That survives being interrupted, which memory doesn't.
Collect references
The List Browser fills up from the Information Browser. Hover a reference there and a flag icon appears on the right of the row; click it to add that reference to the current list. The tooltip names the list it will go to.
To send it somewhere else instead, Ctrl-click the icon (⌘-click on macOS) and pick a list — that's how you keep separate investigations apart rather than piling everything into one.
The window that opens is List Browser, and it can raise itself as soon as items arrive — the Launch List Browser when items are added option.
Flag what you've done
Each row carries three flags, shown as pennants: hollow when unset, filled when set. They are deliberately unlabelled — flag 1, 2 and 3, in the theme's three accent colors (orange, green, blue, adjusted for light or dark). Understand attaches no meaning to them, so you assign one.
A worked convention for debugging — the flags are yours, this is just a starting point:
| Flag | Means |
|---|---|
| 1 | Started looking at this, not finished |
| 2 | Found a problem here — come back |
| 3 | Checked, nothing wrong, done |
You can also filter the list by flag, which is what makes the convention pay off: hide the finished rows and what's left is your remaining work.
The same collect-and-flag loop fits any pass over a set of references — tracking which call sites a refactor still has to touch, working through the functions in a review, or assessing what a change affects. Nothing about it is debugging-specific.
Pair it with the Virtual Debugger
Add a call tree to a list, then step through each function with the Virtual Debugger, flagging rows as you clear them. The debugger tells you what a path does; the list remembers which paths you've already been down.