
Git Coupling is one of the interactive graphs Understand can draw of your code — call trees, dependencies, control flow, and more.
Git Coupling
Languages: AnyTargets: Architectures
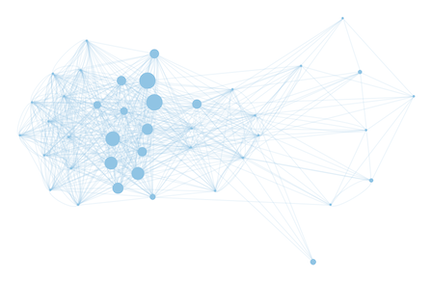
A graph showing the file coupling based on Git history.
Files are nodes, and the edges represent if files were changed in the same commit more than "Minimum Coupling"% of the time. The size of nodes is related to the number of commits involving the file. The color of the nodes/edges indicate what architecture the file belongs to.
Options:
- Minimum Coupling %: Filter out edges that represent a coupling less than this percentage
See also the Git Solution, the blog article ↗ describing the Git plugins, the interactive report Git Coupling, and the metrics Git Average Coupling, Git Max Coupling, Git Coupled Files and Git Strongly Coupled Files. Also related is the architecture metric Git Cohesion .
This variant is a plugin. It can be enabled/disabled from the Plugin Manager.