
Input Output Diagram is one of the interactive graphs Understand can draw of your code — call trees, dependencies, control flow, and more.
Input Output Diagram
Languages: C, C++Targets: Functions
Show how function inputs affect outputs
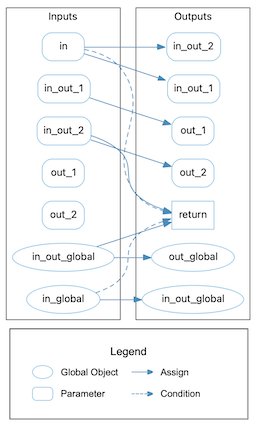
Show the inputs and outputs of a function, with edges showing how the two connect. Inputs are calculated similar to the CountInput metric except that all parameters are always shown as inputs and calls are not considered. Outputs are calculated like CountOutput except calls are not considered. More information on those two metrics can be found in the interactive reports Inputs Metric and Outputs Metric.
For example, see the following code and corresponding graph
  unsigned int in_global;
  unsigned int out_global;
  unsigned int in_out_global;
  int inOutFunc(
    int in,
    int *in_out_1,
    int &in_out_2,
    int* out_1,
    int & out_2)
  {
    // direct assignments
    *out_1 = *in_out_1;
    out_2 = in_out_2;
    out_global = in_out_global;

    // Things that are both inputs and outputs appear in both parts of the graph
    *in_out_1 = in;
    in_out_2 = in;
    in_out_global = in_global;

    // The graph shows conditionals as dashed edges
    if (in > in_global) {
      return 1;
    }

    // Returns work like assignments
    return in_out_global + in_out_2;
  }
This variant is a plugin. It can be enabled/disabled from the Plugin Manager.