
Most Complex Functions is one of the interactive graphs Understand can draw of your code — call trees, dependencies, control flow, and more.
Most Complex Functions
Languages: AnyTargets: Architectures, Classes, Files, Project
Visualize the top functions by complexity.
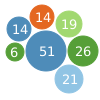
This plugin visualizes the most complex functions found in your project using a bubble chart. Each bubble represents a specific function, and the size of the bubble corresponds to the complexity. This allows you to quickly identify the most complex functions and prioritize your code improvement efforts.
The plugin is a sample of how to recreate the chart on the welcome page, and also allows changing the metric to another Cyclomatic metric.
This variant is a plugin. It can be enabled/disabled from the Plugin Manager.