
Treemap Demo is one of the interactive graphs Understand can draw of your code — call trees, dependencies, control flow, and more.
Treemap Demo
Languages: AnyTargets: Architectures
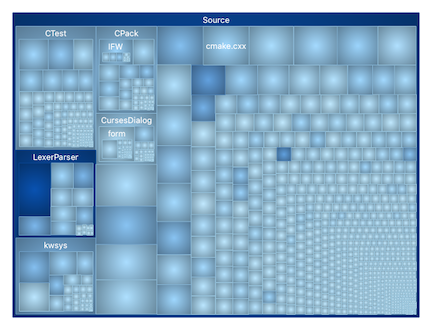
Visualize the architecture hierarchy using a treemap
This plugin visualizes the architecture hierarchy using a treemap, where each rectangle represents a component in the architecture. The size of the rectangle corresponds to the component's lines of code, and the color represents its Max Cyclomatic Complexity. This combined representation provides insights into both the size and complexity of different parts of your codebase.
This is a sample plugin demonstrating how to use the treemap layout, including clusters, and how to use the shared color library to scale the colors and use radial gradients.
This variant is a plugin. It can be enabled/disabled from the Plugin Manager.