
Uses is one of the interactive graphs Understand can draw of your code — call trees, dependencies, control flow, and more.
Uses
Languages: Fortran, VHDLTargets: Modules, Subprograms
Variants: Classic, Cluster, Compare, Relationship, Simplified
Show the Fortran modules or VHDL design units a selected module or design unit uses, directly or indirectly.
For a selected Fortran module, block data, program, function, subroutine, or procedure, this shows an edge to each module it uses, then recurses into each of those modules’ own uses, building a multi-level tree. For a selected VHDL architecture, configuration, entity, or package, this shows the same relationship for VHDL’s use clause.
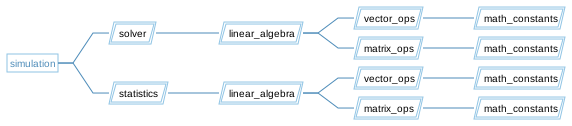
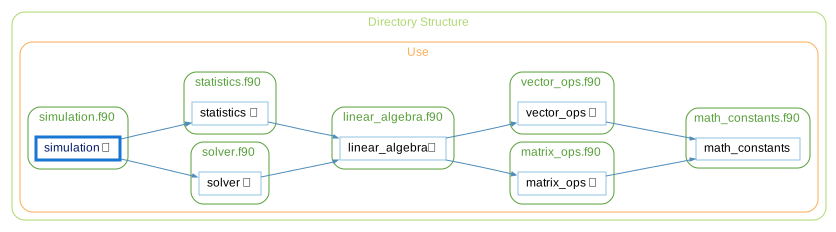
Rooted at the program simulation below, the graph shows it using solver and statistics, both of which use linear_algebra. linear_algebra itself uses vector_ops and matrix_ops, and each of those uses math_constants, which uses nothing further. The inverse graph, Used By, shows the reverse relationship — everything that uses the selected module or design unit, directly or indirectly.
See the following code and corresponding graph
module math_constants
end module math_constants

module vector_ops
  use math_constants
end module vector_ops

module matrix_ops
  use math_constants
end module matrix_ops

module linear_algebra
  use vector_ops
  use matrix_ops
end module linear_algebra

module statistics
  use linear_algebra
end module statistics

module solver
  use linear_algebra
end module solver

program simulation
  use solver
  use statistics
end program simulation
Uses - Classic
The Classic variant is similar to the Simplified variant, showing all relationships in a simple tree, but it uses a custom layout algorithm instead of Graphviz.
Uses - Cluster
The Cluster variant groups entities by their containing class/file/architecture.
Uses - Compare
The Compare variant shows how the graph has changed relative to the project's comparison database.

Uses - Relationship
The Relationship variant filters the graph to only paths connecting the two entities.

Uses - Simplified
The Simplified variant shows all relationships in a simple tree (no clusters)
