
Functions Metric Chart is one of the interactive graphs Understand can draw of your code — call trees, dependencies, control flow, and more.
Functions Metric Chart
Languages: AnyTargets: Architectures, Classes, Files, Project
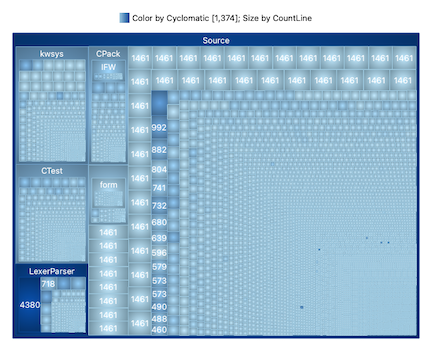
Visualize the functions in the project / architecture / file / class.
This chart allows selecting a size metric and a color metric. Functions are nodes with size determined by size metric and the color scaled by color metric. Several layouts are available.
See also the similar metric charts for architectures, files, and classes .
This variant is a plugin. It can be enabled/disabled from the Plugin Manager.