
Git History Bar Chart is one of the interactive graphs Understand can draw of your code — call trees, dependencies, control flow, and more.
Git History Bar Chart
Languages: AnyTargets: Architectures, Files, Project
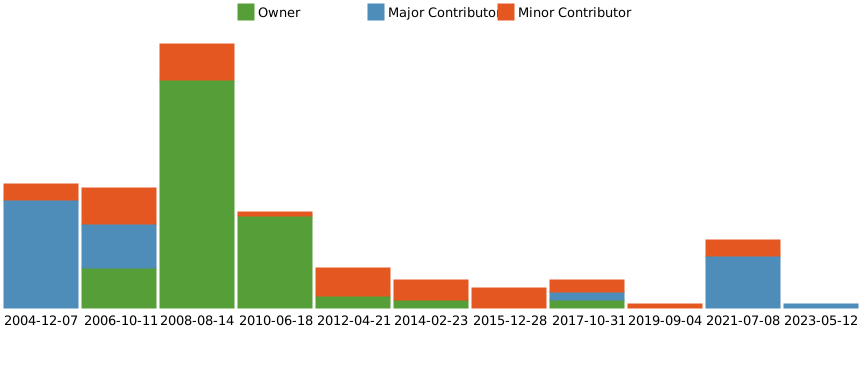
Displays a stacked bar chart of git commits over time.
Each bar represents a period of time (x-axis) and with the total height representing the total number of commits in that period (y-axis). Each bar is broken down into three colors which represent the type of contributor for that commit:
- Green represents commits by the owner, that is the individual who contributed the most to this entity.
- Blue represents commits by major contributors, or those individuals who contributed a significant number of commits, but less than the owner.
- Orange represents commits by minor contributors, or those who only made a few contributions to the entity.
See also the Git Solution, the blog article ↗ describing the Git plugins, the interactive report Git Commits, the architectures Git Date and Git Stability, and the metrics Commits, Days since creation and Days since modified .
This variant is a plugin. It can be enabled/disabled from the Plugin Manager.