
Lines Bar Chart is one of the interactive graphs Understand can draw of your code — call trees, dependencies, control flow, and more.
Lines Bar Chart
Languages: AnyTargets: Architectures
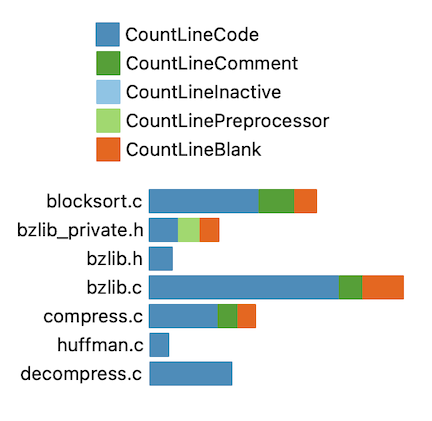
Display a bar chart of line counts for each component
This plugin generates a bar chart that visualizes the number of lines of code, comments, inactive code, preprocessor directives, and blank lines for each entity or child architecture in your architecture. This allows you to quickly compare the composition of different components and identify areas with high proportions of specific line types.
It's intended as a sample plugin for the bar chart layout algorithm. It offers several customization options highlighting layout options:
- Legend: Control the placement or hiding of the legend.
- RankDir: Choose the orientation of the bars (left-to-right, right-to-left, top-to-bottom, bottom-to-top).
- Axis Labels: Display component names or full names as labels.
- Metrics: Select specific line count metrics to include in the chart.
- Counts: Show or hide the numeric counts on the bars.
- Min/Max: Set minimum and maximum values to filter components in the chart.
- Hide Empty: Exclude components with no lines of code from the chart.
This variant is a plugin. It can be enabled/disabled from the Plugin Manager.