Browse metrics (Metrics Browser)
The Metrics Browser is a dockable panel that shows every applicable metric for whatever file, entity, or architecture you're looking at — the live, per-selection counterpart to exporting a CSV of every entity at once.
Open it
Metrics → Browse Metrics, or right-click any file, entity, or architecture → Browse Metrics. It's docked by default; hold Shift while opening to force a separate window instead of reusing an existing one (or use Clone, below).
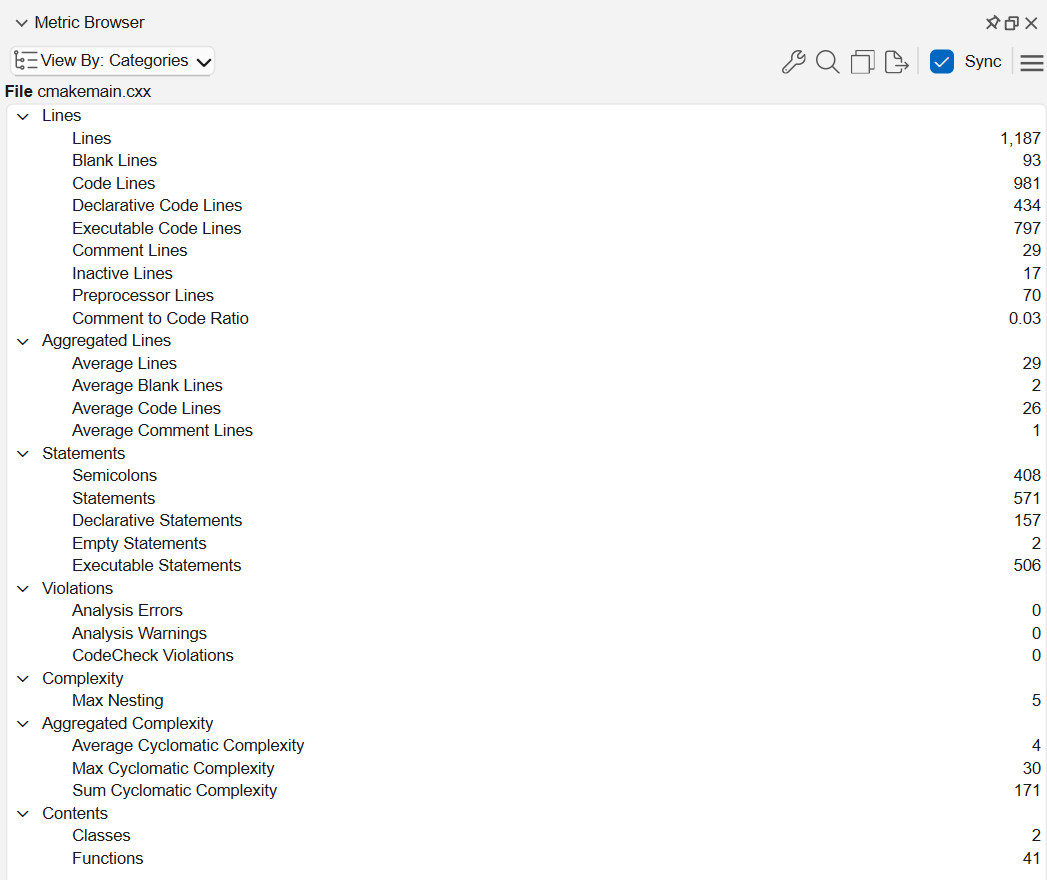
cmakemain.cxx with View By: Categories
— every applicable metric, grouped into named buckets, with Sync on.Group metrics with View By
The View By: … toolbar button controls which metrics are shown and how they're grouped, and the setting is remembered separately for entities and architectures.
The default for entities is Categories, which shows all enabled, applicable metrics grouped into named buckets — Lines, Statements, Complexity, Coupling and Cohesion, and so on. The default for architectures is Architecture Summary, which shows just summary metrics for speed, keeping the same overall categories as Categories. Other views are available too, like Hersteller Initiative Software (HIS) Metrics to show just the HIS metric suite.
Why Architecture Summary sticks to cheap metrics
Every metric in Architecture Summary has a Lookup cost —
stored during analysis, so rolling it up across every entity the architecture contains is fast.
Switch View By to Categories for an architecture if you need a Query, Cached, or
Slow metric too; it gets recalculated across the whole architecture every time you view it,
so expect it to be slower.
ID vs. friendly name
The panel's options (dimple) menu has Show API ID / Show Name, if you'd
rather see a metric's scriptable ID (e.g. CountLineCode) than its display name in the list.
Follow other views: Sync
The Sync checkbox keeps the Metrics Browser pointed at whatever you select elsewhere — browse to what you're interested in using another view, such as the Entity Filter or Architecture Browser, and the Metrics Browser updates to match without you touching it directly. It's on by default for the first Metrics Browser you open.
Pin a selection: Clone
Opening a second Metrics Browser (via Clone on the toolbar, or Shift as above) copies the current selection into the new window, but leaves its Sync off by default — so the clone stays pinned to what you had selected while the original keeps syncing to whatever you select next. That makes it easy to compare two entities or architectures side by side, or keep one pinned for reference while you keep browsing.
Search, and export
The Search action (or Ctrl+F) filters the currently shown metrics list. The Export action opens the same Export Metrics dialog documented in Export & track metrics over time.
Enable or disable metrics: Configure
The Configure action opens the Plugin Manager filtered to metrics, where every metric — built-in and script — can be individually enabled or disabled. Only enabled metrics that apply to the current selection show up in the Metrics Browser (and in the Export Metrics dialog); double-clicking a metric row jumps straight to that metric in Configure instead of opening the whole list.
Where to next
- What metrics does Understand have? — the metric catalog and categories.
- Export & track metrics over time — CSV export and
und metrics. - Rank & compare entities by a metric — sortable rankings instead of a per-selection view.
- Where is my risky / complex code? — the Treemap, Heatmap, and Home dashboard for a project-wide view.